제 14장 📒데이터 시각화_matplotlib📒
🧷 Matplotlib
- 파이썬 기반 데이터 분석 환경에서 가장 일반적으로 사용되는 시각화 라이브러리
- 하위 라이브러리인 'pyplot'을 통해 주요 기능을 사용
- plotly, seaborn 등과 같은 라이브러리가 최근 경쟁력을 갖추고 있음
- pandas 객체의 기본적인 시각화 도구
- plot() 메서드를 통해 데이터를 시각화
- 종류
- 라인 플롯(line plot)
- 바 차트(bar chart)
- 히스토그램(histogram)
- 박스 플롯(box plot)
- 스캐터 플롯(scatter plot)
- 라이브러리 가져오기
✅ import matplotlib.pyplot as plt
✅ cmd: pip install matplotlib
plt.plot(y)
- 기본 : 라인 플롯(line plot)
- 데이터가 시간, 순서 등에 따라 변화하는 흐름 파악
- x가 주어지지 않을 경우 자동 생성 :x = range(len(y))
-데이터 생성 : ()개의 아이템을 가지는 리스트
- plot(data) : 기본적으로 y축의 값으로 데이터를 매칭시킴
- x -> len(data) 만큼의 인덱스번호를 생성
- 기본 plot = line plot
✅ plt.plot([ ])
1. x tick(x축 값) 설정
- plt.plot(x,y) : x에 넣어준 리스트와 y에 넣어준 리스트의 길이가 같아야함
✅ plt.plot([ ],[ ])
2. 축 이름과 plot 제목 지정
- plot 제목 : plt.title('title')
- x축 이름 : plt.xlabel('x_name')
- y축 이름 : plt.ylabel('y_name')
✅ plt.plot([ ],[ ])
✅ plt.title(' ')
✅ plt.xlabel(' ')
✅ plt.ylabel(' ')
3. 두 개의 선을 그리기
각각의 라인 그래프를 순차적으로 plt.plot() 명령어로 입력
- 범례(legend) 추가
plt.legend()
4. 스타일 지정
- plt.plot([x], y, [fmt], **kwargs)
- fmt : '[color][marker][line]'
- 색상, 마커, 선 등에 대한 포맷 옵션 설정
- fmt : '[color][marker][line]'
1) 마커 참조 도큐먼트 주소
https://matplotlib.org/3.1.3/api/markers_api.html
2) 색상 참조 도큐먼트 주소
https://matplotlib.org/3.1.0/gallery/color/named_colors.html
3) 라인 스타일 참조 도큐먼트 주소
https://matplotlib.org/gallery/lines_bars_and_markers/line_styles_reference.html
4-1) 스타일 문자열 추가 : [fmt] => color + maker + line 순서대로 문자열 작성
어느 요소를 생략하면 해당 생략된 요소는 기본값으로 적용
'o' : 라인 없이 큰 점(원모양) 으로 데이터 위치 표시
✅ plt.plot([ ],[ ], 'o')
4-2) o- : 마커는 동그라미, 라인은 실선
fmt[색상][마커][선종류]
✅ plt.plot([1,2,3,4],[2,6,10,7], 'o-')
4-3) o-- : 마커는 동그라미, 선은 점선
✅ plt.plot([ ],[ ], 'o--')
4-4) ro: : r(빨간색),o(마커),:(점으로된 점선)
✅ plt.plot([ ],[ ], 'ro:')
※ 기타 스타일 파라미터 종류
- color : 색상(magenta)
- linestyle : -.
- marker : ^
- markerfacecolor : orange
- markersize : 20
plt.plot([ ], [ ],
color = ' ', linestyle=' ', marker=' ',
markeredgecolor=' ', markerfacecolor=' ', markersize=' ')
위의 도큐먼트 참고해서 다양한 스타일 구현 가능
5. 축 범위 지정
📌 matplotlib.pyplot.axis
- plt.axis([xmin, xmax, ymin, ymax])
- xmin : x축 최소값
- xmax : x축 최대값
- ymin : y축 최소값
- ymax : y축 최대값
📌 matplotplib.pyplot.xlim / ylim
- plt.xlim(min, max)
- plt.ylim(min, max)
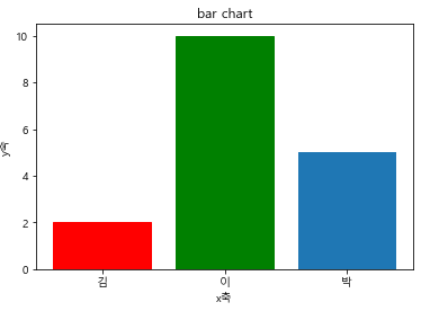
🔑 Bar chart (막대 그래프)
- 여러 값의 상대적인 크기를 비교하기에 적합한 표현법이며 원형 차트보다 더욱 일반적으로 사용됨
- plt.bar(x, y)
- x 데이터가 카테고리 값인 경우에는 bar, barh 로 바 차트 시각화 표현
- 가로 방향으로 바 차트를 그리려면 barh
- barh 차트 주의점 : x축이 일반적으로 y축의 위치를 의미
ex)
x = ['가', '나', '다']
y = [2,10,5]
plt.bar(x,y)
plt.show()

📌 바마다 붙일 이름을 바꿔주고 싶다면, xticks를 씁니다.
- 각각의 bar마다 색상 변경하기
🧷 plt.bar() 객체 set_color()
✅ bar_list = plt.bar(x,y)
bar_list[0].set_color('r')
bar_list[1].set_color('g')
ex)